Problem description
When working with Gitlab in the Chrome Browser, sometimes it is not possible to load the page or perform a request (like pressing a button), the default error page is shown, see the screenshot. This happens at random times: 5 minutes after logging in or 6 hours later.

Note that the site works most of the time in this configuration, it only fails sometimes, about one time per day per user.
The installation is available in other browsers (tried with Firefox) at the same time, which excludes network errors. Screenshot from firefox the same time it is not working in Chrome:

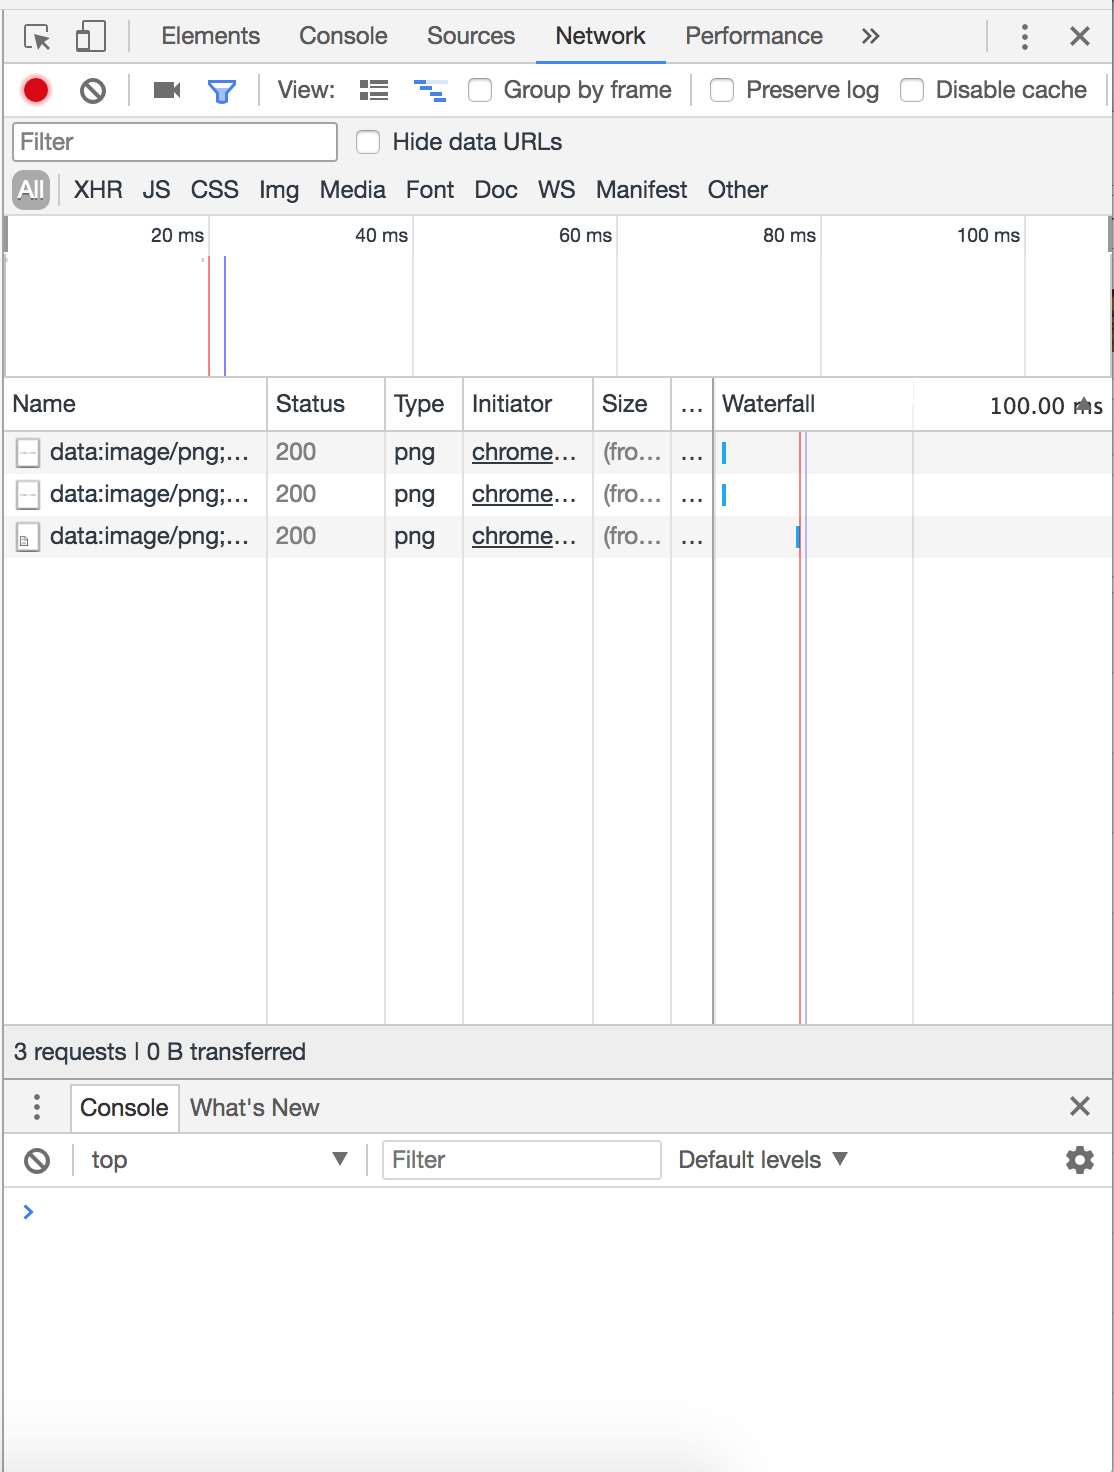
The Chrome browser doesn’t load anything when looking at the network-tab of the “inspect site” feature and refreshing the page, while firefox shows the loading of the content.
The browser (62.0.3202.94), OS (MacOS 10.13.1) and gitlab (10.1.4) are up to date, but it also happened in older gitlab versions (we are not using gitlab that long, but I don’t remember which was the first version we used).
When the problem appears, it is necessary to close and restart Chrome, directly after that, the site can be reached. Refreshing (including hard refresh with clearing cache or clicking on the adress bar and press enter) doesn’t solve the problem.
Sometimes, after some time, the browser reloads the page and the site is loaded again, but this can take pretty long (also from minutes to hours).
The issue affects multiple persons in my team, therefore local settings should not be the problem.
If relevant, gitlab runs in a docker container.
If logs required, please let me know, I will update the question.
Results of GitLab environment info
Expand for output related to GitLab environment info
System information
System:
Current User: git
Using RVM: no
Ruby Version: 2.3.5p376
Gem Version: 2.6.13
Bundler Version:1.13.7
Rake Version: 12.1.0
Redis Version: 3.2.5
Git Version: 2.13.6
Sidekiq Version:5.0.4
Go Version: unknownGitLab information
Version: 10.1.4
Revision: c887c03
Directory: /opt/gitlab/embedded/service/gitlab-rails
DB Adapter: postgresql
URL: https://ourUrl
HTTP Clone URL: https://ourUrl/some-group/some-project.git
SSH Clone URL: ssh://ourUrl:ourPort/some-group/some-project.git
Using LDAP: no
Using Omniauth: noGitLab Shell
Version: 5.9.3
Repository storage paths:
- default: /var/opt/gitlab/git-data/repositories
Hooks: /opt/gitlab/embedded/service/gitlab-shell/hooks
Git: /opt/gitlab/embedded/bin/git
The application check passed, if relevant, let me know, I will updated my question.
@markglenfletcher told me this is the right place for such questions, since my issue on https://gitlab.com/gitlab-org/gitlab-ce/issues/40423 was closed.